Sublogo dendrograms are statistical graphics that reveal correlation in biological sequence alignments.
To plot a sublogo dendrogram, just put your sequences in a character vector, and call the sublogo function:
## install dependencies
source("http://bioconductor.org/biocLite.R")
biocLite("Biostrings")
install.packages(c("grImport","gridBase"))
## install package from R-Forge repository
install.packages("sublogo",repos="http://r-forge.r-project.org")
## some test data
library(sublogo)
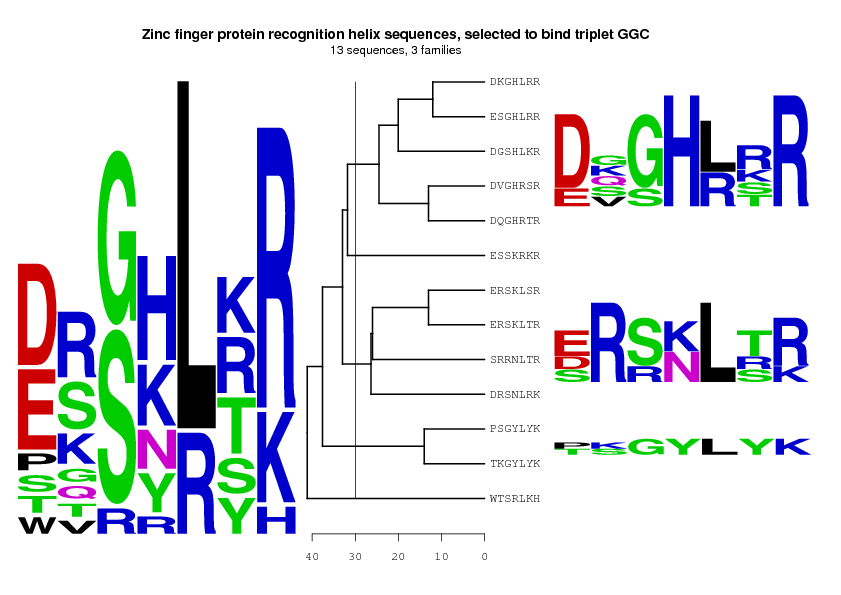
zfp <- c("DQGHRTR","DVGHRSR","ESGHLRR","ESSKRKR","SRRNLTR","TKGYLYK",
"PSGYLYK","WTSRLKH","DKGHLRR","DGSHLKR","DRSNLRK","ERSKLTR","ERSKLSR")
main <- "Zinc finger protein recognition helix sequences, selected to bind triplet GGC"
sublogo(zfp,cutline=30,main=main)
Sublogo dendrograms were presented in a poster at useR! 2009:
[Abstract]
Note that the link to the web interface mentioned in the abstract does
not work for the time being. I would need to get access to a server with PHP
and R.
[Poster]
The project summary page you can find here.